Introducing Interior Design’s 2023 Hospitality Giants
Ever since the pandemic devastated the hospitality industry, we’ve been waiting for the comeback—and 2022 might be it. Interior Design’s Hospitality Giants brought in $576 million total fees, up 36 percent from the previous year. It’s a welcome surge: When 2020 went viral, so to speak, fees dropped by more than half, to $423 million in 2021, after having enjoyed a decade-long ascent from $600 million to a record $1.1 billion in 2019.
Hospitality Giants Rankings 2023
| wdt_ID | 2023 Rank | Firm | HQ Location | Design Fees (in millions) | FFC Value (in millions) | Sq. Ft. (in millions) | 2022 Rank |
|---|---|---|---|---|---|---|---|
| 1 | 1 | HBA International | Santa Monica, CA | 109.50 | 6,569 | 2 | |
| 2 | 2 | Rockwell Group | New York | 32.20 | 4 | ||
| 3 | 3 | Gensler | San Francisco | 24.90 | 6 | ||
| 4 | 4 | Wimberly Interiors | New York | 20.80 | 11 | ||
| 5 | 5 | ForrestPerkins/Perkins Eastman | New York | 20.30 | 5 | ||
| 6 | 6 | Populous | Kansas City, MO | 19.90 | 0 | 7 | |
| 7 | 7 | AvroKO | New York | 18.90 | 1 | 0.8 | 8 |
| 8 | 8 | JCJ Architecture | Hartford, CT | 17.60 | 12 | ||
| 9 | 9 | Yabu Pushelberg | New York | 16.90 | 1.2 | 15 | |
| 10 | 10 | DLR Group | Minneapolis | 15.10 | 2 | 10 |
Hotels still make up the lion’s share of hospitality fees—about 49 percent—but that figure has been in gradual decline since peaking in 2013 at 59 percent. Everyone likes nice things, which helps explain why luxury properties account for two-thirds of hotel income overall ($212 million) with boutique and mid-economy income declining—though the $93 million they brought in is nothing to scoff at.
Restaurants ($80 million, 13 percent) and resorts ($67 million, 11 percent) are the next biggest segments, with gaming and country clubs providing steady fees ($51 million combined). Multiuse remains a wildcard. That sector’s mix of hospitality, residential, and retail accounted for 5 percent of all fees ($34 million) last year but has spiked as high as 18 percent in 2019, and 14 percent in 2021. Who wants to bet big on 2023? Inside info: These Giants predict growth in the number of projects they’ll do—if not necessarily fees—in the boutique hotel, resort/spa/country club, restaurant/bar, and yes, multiuse categories.
Project Categories
| wdt_ID | Categories | Percentage |
|---|---|---|
| 1 | New construction | 48 |
| 2 | Renovation/Retrofit | 44 |
| 3 | Refresh previously completed projects | 8 |
Another plus is that Hospitality Giants logged a record 5,700 projects overall, 350 more than the previous high in 2018—and they forecast that an additional 2,000 (!) will be delivered in 2023. Furniture, fixtures, and construction products also staged a rebound, after having plummeted from a cool $19 billion in 2019 to $6.2 billion in 2021 (that tremor you felt was the sector hitting rock bottom). Climbing back to $14.7 billion in 2022, we’re firmly on the road to recovery—although this uptick might be attributed to post-COVID right-sizing rather than a sign of exponential growth.
That’s the story: a general trend upward from pandemic lows. How much and how quickly? Well, the group projects $602 million in fees in 2023, a return to where we started in 2013, beginning that long climb back to the billion-dollar mark. Here’s hoping it doesn’t take as long this time.
Firms with the Most Fee Growth
| wdt_ID | Firm | 2021 Design Fees | 2022 Design Fees |
|---|---|---|---|
| 1 | Rockwell Group | 22,927,898 | 32,177,300 |
| 2 | Wimberly Interiors | 12,000,000 | 20,750,000 |
| 3 | Yabu Pushelberg | 9,000,000 | 16,850,000 |
| 4 | JCJ Architecture | 11,600,000 | 17,577,000 |
| 5 | HBA International | 103,512,000 | 109,483,000 |
| 6 | HKS | 9,324,462 | 14,725,437 |
| 7 | Premier | 1,850,000 | 7,100,000 |
| 8 | AvroKO | 13,728,837 | 18,893,558 |
| 9 | Baskervill | 8,981,627 | 14,123,069 |
| 10 | PGAL | 2,418,000 | 7,510,000 |
Fees by Project Type
| wdt_ID | Project Type | Actual 2022 | Forecast 2023 |
|---|---|---|---|
| 1 | Total Hotel | 40 | 41 |
| 2 | Hotels (Luxury) | 32 | 33 |
| 3 | Hotels (Boutique) | 9 | 9 |
| 4 | Hotels (Mid/Economy) | 5 | 5 |
| 5 | Micro-hotels | 0 | 0 |
| 6 | Multiuse (Hospitality/Retail/ Residential) | 2 | 2 |
| 7 | Condo-hotels/Timeshares | 5 | 5 |
| 8 | Resorts | 11 | 11 |
| 9 | Spas | 1 | 1 |
| 10 | Country Clubs | 3 | 3 |
| 11 | Gaming | 5 | 5 |
| 12 | Restaurants | 12 | 12 |
| 13 | Bars/Lounges/Nightclubs | 2 | 2 |
| 14 | Cruise Ships | 0 | 0 |
| 15 | Other | 6 | 6 |
Editor’s Note: Take a look at recent coverage of our Hospitality Giants most admired firms of 2023 below. AvroKO tops the list followed by Yabu Pushelberg, and Rockwell Group.
Read More About AvroKO

Projects
AvroKO Channels Savannah’s Hospitality at the Perry Lane Hotel
The Perry Lane Hotel in Savannah, Georgia, is a new ground-up structure with interiors by AvroKO that conjure a bygone era, yet still feel modern.
Projects
AvroKO Channels the Bauhaus and Havana for the Scott, a Luxury Resort in Scottsdale
With large-scale renovation projects, briefs can be tricky—it’s not the easiest feat to carve out a fresh new vision comprehensively complementary to existing bone structure. Such was the challenge for the re…
Projects
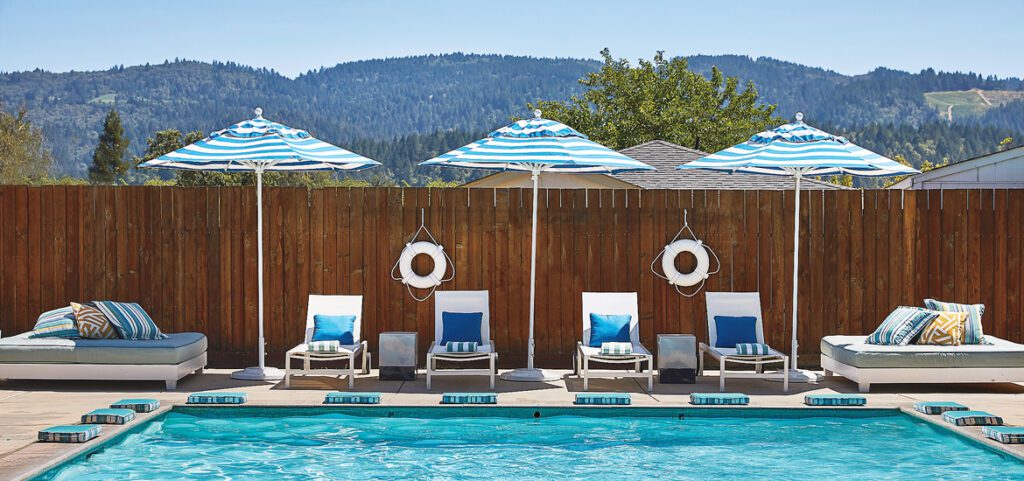
AvroKO Channels Napa Valley Nostalgia for Calistoga Motor Lodge and Spa
AvroKO updates the 1940’s original Sunburst Calistoga roadside cottages into the new Calistoga Motor Lodge and Spa without losing any of its original nostalgia at the Napa Valley location.


Read More About Yabu Pushelberg
Projects
George Yabu and Glenn Pushelberg Design a Dramatic Hotel in Leicester Square
2021 Best of Year winner for Boutique Hotel. Plays staged in the West End have been entertaining theatergoers for over 350 years. As the scene rebounds from pandemic closures, visitors can enjoy that spectacle while stay…
Projects
George Yabu and Glenn Pushelberg Earn a Best of Year Award for This Chic Parisian Store
2021 Best of Year winner for Large Retail. A complex of fin de siècle, art nouveau, and art deco buildings, the last completed in 1928, La Samaritaine, a once-fabled department store in the first arrondissement, has reo…
Projects
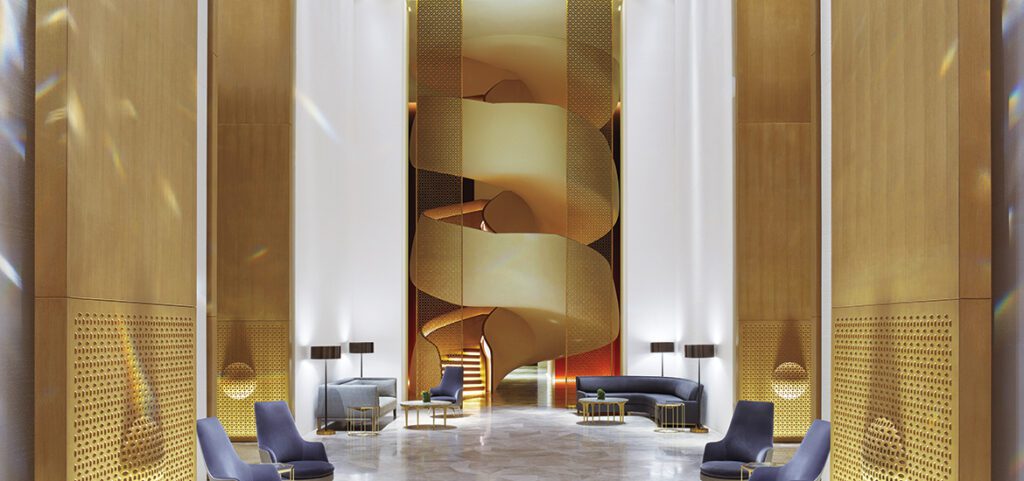
Four Seasons Hotel Kuwait at Burj Alshaya by Yabu Pushelberg: 2018 Best of Year Winner for Chain Hotel
After a period during which hotel designers took inspiration from residential interiors to make guests feel at home, Glenn Pushelberg and George Yabu decided to go in the opposite direction. Guest comfort, of course, rem…


Read More About Rockwell Group
Projects
Rockwell Group Earns a Best of Year Award for the Moynihan Train Hall in New York
2021 Best of Year winner for Transportation – Small. Rockwell Group designed a ticketed waiting area for Amtrak and Long Island Railroad customers that brings the glamour back to travel.
Projects
Lawn by LAB at Rockwell Group: 2019 Best of Year Winner for Architectural Installation/Pop Up
Enjoying a repast on the grass is a quintessential summertime activity. Even when it happens inside. As the latest big-name firm to produce the National Building Museum’s annual Summer Block Party, the LAB team for…
Projects
A Look at the Waterline Club by Rockwell Group
Rockwell Group’s challenge for the Waterline Club was how to make the subterranean project light and uplifting. The Best of Year winner met the call.


Growth Potential Over Next 2 Years
U.S.
| wdt_ID | Region | Percentage |
|---|---|---|
| 1 | Northeast | 47 |
| 2 | Midsouth | 44 |
| 3 | Southeast | 71 |
| 4 | Mid-Atlantic | 41 |
| 5 | Midwest | 30 |
| 6 | Northwest | 22 |
| 7 | Southwest | 73 |
International
| wdt_ID | Region | Percentage |
|---|---|---|
| 1 | Canada | 10 |
| 2 | Mexico | 19 |
| 3 | Central/South America | 10 |
| 4 | Caribbean | 25 |
| 5 | Europe | 18 |
| 6 | Middle East | 26 |
| 7 | Africa | 3 |
Asia
| wdt_ID | Region | Percentage |
|---|---|---|
| 1 | China | 16 |
| 2 | India | 7 |
| 3 | Asia/Australia/New Zealand | 11 |
| 4 | Other | 4 |
Forecasted Change by Segment Over Next Two Years
| wdt_ID | Segment | More Projects | No Change | Fewer Projects |
|---|---|---|---|---|
| 1 | Luxury Hotels | 56 | 28 | 2 |
| 2 | Boutique Hotels | 63 | 21 | 5 |
| 3 | Mid/Economy Hotels | 41 | 35 | 2 |
| 4 | Micro-hotels | 16 | 3 | 2 |
| 5 | Condo-hotels/Timeshare | 22 | 35 | 2 |
| 6 | Multiuse | 62 | 16 | 1 |
| 7 | Restaurants/Bars/Lounges/Nightclubs | 58 | 21 | 5 |
| 8 | Resorts/Spas/Country Clubs | 62 | 21 | 4 |
| 9 | Gaming | 26 | 26 | 2 |
| 10 | Cruise Ships | 5 | 31 | 4 |
Methodology
The Interior Design Giants annual business survey comprises the largest firms ranked by interior design fees for the 12-month period ending December 31, 2022. The listings are generated from only those surveyed. To be recognized as a top 100, Rising, Healthcare, or Hospitality Giant, you must meet the following criteria: Have at least one office location in North America, and generate at least 25% of your interior design fee income in North America. Firms that do not meet the criteria are ranked on our International Giants list. Interior design fees include those attributed to:
1. All aspects of a firm’s interior design practice, from strategic planning and programming to design and project management.
2. Fees paid to a firm for work performed by employees and independent contractors who are “full-time staff equivalent.”
Interior design fees do not include revenues paid to a firm and remitted to subcontractors who are not considered full-time staff equivalent. For example, certain firms attract work that is subcontracted to a local firm. The originating firm may collect all the fees and retain a management or generation fee, paying the remainder to the performing firm. The amounts paid to the latter are not included in fees of the collecting firm when determining its ranking. Ties are broken by rank from last year. Where applicable, all percentages are based on responding Giants, not their total number.
All research conducted by ThinkLab, the research division of SANDOW Design Group.
read more
Awards
Interior Design’s 2022 Best of Year Award Winners
See Interior Design’s 2022 Best of Year Award winners, representing the best A&D projects and products from across the globe.
Research
Interior Design Unveils the 2023 Top 100 Giants
Interior Design unveils the Top 100 Giants of 2023. Research suggests the A&D industry is bouncing back after a challenging few years. See the stats.
Research
Interior Design Unveils the 2022 Hospitality Giants
What does the future of hospitality design look like? Check out Interior Design’s latest Hospitality Giants report.

recent stories
Research
ThinkLab’s Visionary Jeffersonian Dinners Forge New Paths for Local Design
ThinkLab explains how design experts can engage in Jeffersonian dinners to listen, learn, debate, and inspire one another through meaningful dialogue.
Research
Interior Design Unveils the 2023 Sustainability Giants
Eco-conscious design is here. See the trends found among the top 100 environmentally focused firms in Interior Design’s 2023 Sustainability Giants.
Research
Interior Design Spotlights 2023 Healthcare Giants
Three years after the start of the pandemic, the 2023 Interior Design Healthcare Giants give a pulse on the state of healthcare design today.