Interior Design Reveals the 2023 Rising Giants
There’s rising and then there’s Rising. Our list of the second 100 largest firms injected the moniker with helium in 2022. Total fees came in at $532 million, a 50 percent increase from 2021—well above the recent low of $314 million in 2020, and a hair above pre-pandemic numbers.
Rising Giants 2023
| wdt_ID | 2023 Rank | Firm | Headquarters | Design Fees (in millions) | FFC Value (in millions) | Sq. Ft. (in millions) | Design Staff | 2022 Overall Rank |
|---|---|---|---|---|---|---|---|---|
| 1 | 101 | Wolcott Architecture | Los Angeles | 10.04 | 0.14 | - | 45 | 93A |
| 2 | 102 | Array Architects | Conshohocken, PA | 9.46 | 420.00 | - | 78 | NEW |
| 3 | 103 | Chambers | Baltimore | 9.41 | 9.41 | - | 37 | 92 |
| 4 | 104 | Aria Group Architects | Oak Park, IL | 9.35 | 13.30 | 1.17 | 67 | 95 |
| 5 | 105 | tvsdesign | Atlanta | 9.17 | 0.10 | - | 63 | 78 |
| 6 | 106 | Kasian Architecture, Interior Design and Planning | Vancouver, Canada | 9.14 | 0.00 | - | 157 | 100 |
| 7 | 107 | CBRE Design Collective | Dallas | 9.10 | 364.44 | - | 67 | NEW |
| 8 | 108 | KZF Design | Cincinnati | 9.03 | 706.00 | 6.12 | 77 | 88 |
| 9 | 109 | EDG Interior Architecture and Design | Novato, CA | 9.00 | 115.00 | 0.55 | 53 | 120 |
| 10 | 110 | Tricarico Architecture and Design | Wayne, NJ | 8.88 | 432.00 | 2.9 | 15 | 188 |
“-“ did not report data
As for the breakdown of business segments, hospitality is to the Rising Giants what corporate projects are to the top 100: the big money driver. But while that sector remained a solid number one last year, it’s down to 30 percent of overall fees ($162 million) compared to 38 percent two years ago. Corporate is second, at 25 percent ($131 million), followed by residential at 17 percent ($89 million), and healthcare at 9 percent ($46 million). The Rising Giants predict only gentle fluctuations in this breakdown for 2023, forecasting a slight drop in corporate and a rise in residential, with hospitality holding firm.
Meanwhile, furniture, fixtures, and construction products appear to be booming—more than doubling, to $35.8 billion—but that figure is driven by large totals from a single firm. Still, FF&C had already been rebounding well from a pandemic low of $10 billion in 2020, and the Rising Giants forecast $38 billion for next year.
Furnishings & Fixtures vs. Construction
As with the 100 Giants, the relationship between number of projects and total square footage is somewhat imbalanced. Projects truly popped, at almost 23,000—up from 15,000 in 2021 and nearly doubling the pre-pandemic figure of 12,000 in 2019. Square footage, at 188 million, doesn’t track with it, however. That’s a slight bump from 2021 but a pipe dream compared to 301 million in 2019, likely resulting from firms diversifying their services (more consulting and branding projects), plus hybrid work affecting client’s spatial allocations.
Risers, like the 100, have seen an influx of new talent to execute this work. Design staff members, which had hovered around 2,600 for the past three years, jumped 62 percent to nearly 4,200 in 2022. The all-employee total also increased 27 percent.
Recruiting and retaining qualified staff remains the biggest challenge, so salaries have also risen since 2019. Most employees have seen a 14 to 16 percent raise (project managers/directors excepted), and the average designer salary has climbed to $80,000—the highest since we’ve tracked this data.
Will all this good business hold? This group has offered a healthy 2023 forecast of $583 billion in total fees, a 10 percent increase. And while most are confident about this prediction, fewer are saying they’re “very” or “extremely” so. Semantics? Perhaps. But the Rising Giants are rising indeed.
See the 2023 Top 100 Giants here.
Firms with the Most Fee Growth
| wdt_ID | Firm | 2021 | 2022 |
|---|---|---|---|
| 1 | Tricarico Architecture and Design | 1,300,000 | 8,880,000 |
| 2 | Premier | 2,000,000 | 7,100,000 |
| 3 | Beasley & Henley Interior Design | 5,144,000 | 8,713,480 |
| 4 | EDG Interior Architecture and Design | 5,595,000 | 9,000,000 |
| 5 | Steelman Partners | 6,178,375 | 8,718,000 |
| 6 | Hendrick | 4,000,000 | 6,500,000 |
| 7 | KTGY Simeone Deary Design Group | 4,400,000 | 6,800,000 |
| 8 | Flick Mars | 2,476,125 | 4,857,944 |
| 9 | BKV Group | 1,213,000 | 3,500,000 |
| 10 | Bar Napkin Productions | 4,000,000 | 6,000,000 |
Fees by Project Type
| wdt_ID | Project Type | 2022 Actual | 2023 Forecast |
|---|---|---|---|
| 1 | Hospitality | 161,626,361 | 178,279,921 |
| 2 | Corporate Offices | 131,132,773 | 129,297,668 |
| 3 | Residential | 88,622,756 | 101,603,194 |
| 4 | Healthcare | 46,421,082 | 50,486,342 |
| 5 | Education | 21,683,950 | 22,979,378 |
| 6 | Retail | 18,469,636 | 19,585,483 |
| 7 | Mixed-use (new) | 13,502,611 | 16,291,824 |
| 8 | Government | 10,840,486 | 11,416,606 |
| 9 | Cultural | 3,094,278 | 3,829,466 |
| 10 | Transportation* | 3,711,495 | 2,083,466 |
| 11 | Manufacturing/Warehouse/Data Centers (new) | 2,670,883 | 2,434,869 |
| 12 | Life Sciences (new) | 2,130,859 | 2,280,060 |
| 13 | Sports Centers (new) | 1,179,911 | 1,263,705 |
| 14 | Other* | 20,409,666 | 21,709,883 |
Practice Issues
| wdt_ID | Practice Issues | Percentage |
|---|---|---|
| 1 | Recruiting qualified staff | 89 |
| 2 | Training staff | 43 |
| 3 | Retaining staff | 40 |
| 4 | Creating new business/Diversifying into new segments | 31 |
| 5 | Recruiting diverse staff | 28 |
| 6 | Offering staff appropriate pay scale and benefits | 28 |
| 7 | Marketing firm’s capabilities | 20 |
| 8 | Keeping track of profits and expenses | 4 |
Client Issues
| wdt_ID | Client Issues | Percentage |
|---|---|---|
| 1 | Retaining current clients | 4.30 |
| 2 | New competing business entities entering the market (I.e., Co-working, CRE services, etc.) | 12.80 |
| 3 | Finding new clients | 25.50 |
| 4 | Client willingness to take design risks | 29.80 |
| 5 | Managing client expectations | 40.40 |
| 6 | Getting clients to understand design value | 52.10 |
| 7 | Client willingness to pay what it’s worth | 66.00 |
Business Issues
| wdt_ID | Business Issues | Percentage |
|---|---|---|
| 1 | Earning appropriate fees | 66 |
| 2 | Uncertain economy | 62 |
| 3 | Dealing with clients’ increasing demands | 54 |
| 4 | Increasing interference from clients’ consultants | 21 |
| 5 | Managing vendors | 20 |
| 6 | Managing the growing need for sustainable design | 12 |
| 7 | Creating cutting-edge design solutions | 10 |
Most Admired Firms
Editor’s Note: Take a look at recent coverage of our Rising Giants most admired firms of 2023 below. Gensler tops the list followed by Rockwell Group and AvroKO.
Read More About Gensler

DesignWire
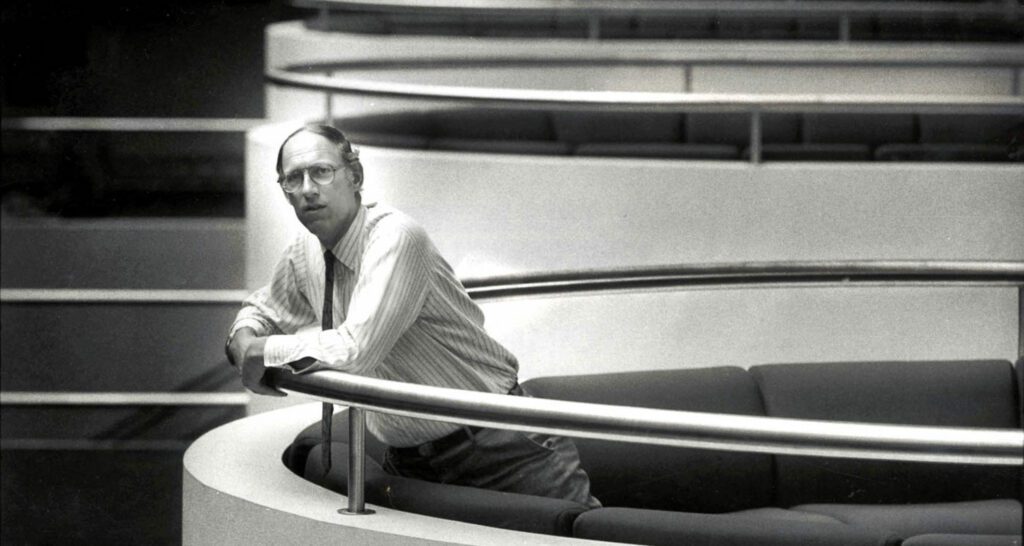
A Tribute to Art Gensler and the Monumental Impact of His Legacy
A tribute to Art Gensler’s illustrious career honors his firm’s role in shaping the future of global design — and the environments defining its cutting edge.
Projects
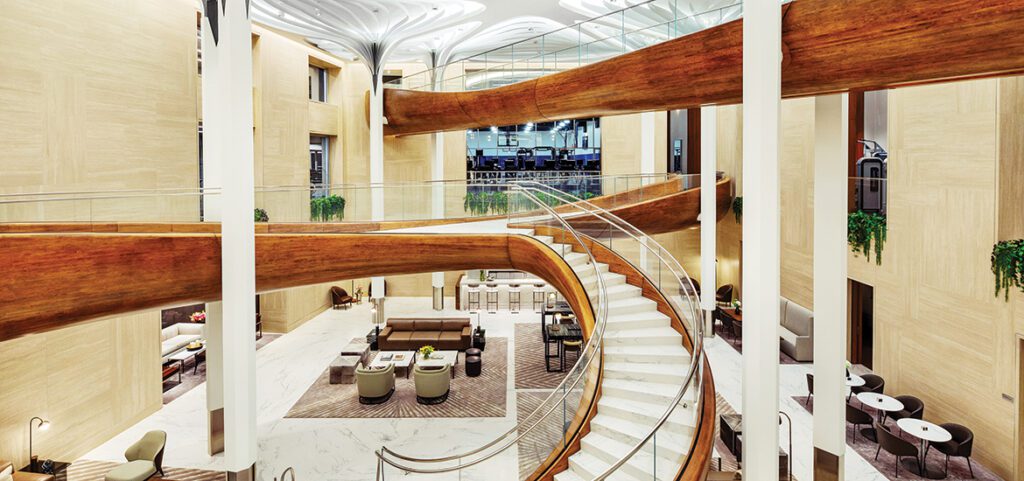
Gensler Transforms an Outdated Lobby into a Collaborative Hub
Gensler’s renovation of 4300 Wilson, a 2003 office building in Arlington, Virginia, features an extended lobby experience and fitness center.
DesignWire
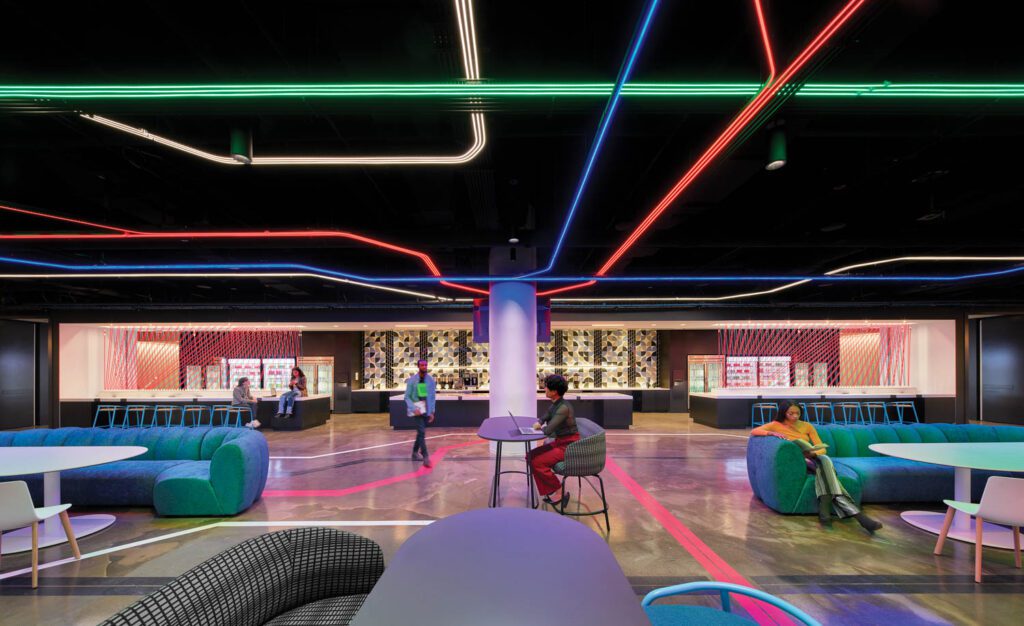
For TikTok’s New York Office, Gensler Captures the Soul of the City
For the TikTok New York office, Gensler crafts a colorful space that celebrates the soul of the city complete with neon lights.

Read More About Rockwell Group
Projects
Rockwell Group Earns a Best of Year Award for the Moynihan Train Hall in New York
2021 Best of Year winner for Transportation – Small. Rockwell Group designed a ticketed waiting area for Amtrak and Long Island Railroad customers that brings the glamour back to travel.
Projects
A Look at the Waterline Club by Rockwell Group
Rockwell Group’s challenge for the Waterline Club was how to make the subterranean project light and uplifting. The Best of Year winner met the call.
Projects
Lawn by LAB at Rockwell Group: 2019 Best of Year Winner for Architectural Installation/Pop Up
Enjoying a repast on the grass is a quintessential summertime activity. Even when it happens inside. As the latest big-name firm to produce the National Building Museum’s annual Summer Block Party, the LAB team for…


Read More About AvroKO
Projects
AvroKO Channels Savannah’s Hospitality at the Perry Lane Hotel
The Perry Lane Hotel in Savannah, Georgia, is a new ground-up structure with interiors by AvroKO that conjure a bygone era, yet still feel modern.
Projects
AvroKO Channels the Bauhaus and Havana for the Scott, a Luxury Resort in Scottsdale
With large-scale renovation projects, briefs can be tricky—it’s not the easiest feat to carve out a fresh new vision comprehensively complementary to existing bone structure. Such was the challenge for the re…
Projects
AvroKO Crafts Inkwell Apartments From NYC Elementary School
AvroKO and BHDM Design Craft Inkwell Apartments From Former NYC Academy


Project Categories
| wdt_ID | Project Categories | Percentage |
|---|---|---|
| 1 | New Construction | 46 |
| 2 | Renovation/Retrofit | 45 |
| 3 | Refresh: Cosmetic Changes Only | 9 |
Total Projects by Type
| wdt_ID | Project Type | 2022 | 2023 Forecast |
|---|---|---|---|
| 1 | Office | 371,462 | 408,254 |
| 2 | Hospitality | 2,659 | 3,033 |
| 3 | Retail | 1,350 | 1,724 |
| 4 | Government | 885 | 1,076 |
| 5 | Healthcare/Assisted Living | 16,661 | 3,154 |
| 6 | Education | 1,014 | 1,165 |
| 7 | Residential | 287,507 | 316,397 |
| 8 | Transportation | 103 | 103 |
| 9 | Cultural | 442 | 493 |
| 10 | Life Sciences (new) | 503 | 100,643 |
Project Locations
International Project Locations
| wdt_ID | Location | Percentage |
|---|---|---|
| 1 | Canada | 38 |
| 2 | Mexico | 23 |
| 3 | Caribbean | 26 |
| 4 | Central/South America | 3 |
| 5 | Europe | 21 |
| 6 | Asia/Pacific Rim | 31 |
| 7 | Africa | 13 |
| 8 | Other | 15 |
Total FFC Value
| wdt_ID | Year | FFC Value |
|---|---|---|
| 1 | 2022 Actual | 2,147,483,647 |
| 2 | 2023 Forecast | 2,147,483,647 |
Square Feet Installed
| wdt_ID | Year | Square Feet Installed |
|---|---|---|
| 1 | 2022 Actual Sq. Ft | 188,289,490 |
| 2 | 2023 Forecast Sq. Ft | 210,081,326 |
Salary
| wdt_ID | Job Title | Median Annual Salary |
|---|---|---|
| 1 | Principals/Partners | 182,885 |
| 2 | Project Managers/Directors | 105,000 |
| 3 | Designers | 80,000 |
| 4 | Other Interior Design Staff | 65,000 |
Hourly Rate
| wdt_ID | Job Title | Median Hourly Rate |
|---|---|---|
| 1 | Principals/Partners | 250 |
| 2 | Project Managers/Directors | 171 |
| 3 | Designers | 134 |
| 4 | Other Interior Design Staff | 100 |
Billable Time
| wdt_ID | Billable Time | 2023 Giants |
|---|---|---|
| 1 | < 70% | 17 |
| 2 | 70-79% | 15 |
| 3 | 80-89% | 38 |
| 4 | 90-99% | 21 |
| 5 | 100% | 8 |
| 6 | Average | 80 |
Methodology
The Interior Design Giants annual business survey comprises the largest firms ranked by interior design fees for the 12-month period ending December 31, 2022. The listings are generated from only those surveyed. To be recognized as a top 100, Rising, Healthcare, or Hospitality Giant, you must meet the following criteria: Have at least one office location in North America, and generate at least 25% of your interior design fee income in North America. Firms that do not meet the criteria are ranked on our International Giants list. Interior design fees include those attributed to:
1. All aspects of a firm’s interior design practice, from strategic planning and programming to design and project management.
2. Fees paid to a firm for work performed by employees and independent contractors who are “full-time staff equivalent.”
Interior design fees do not include revenues paid to a firm and remitted to subcontractors who are not considered full-time staff equivalent. For example, certain firms attract work that is subcontracted to a local firm. The originating firm may collect all the fees and retain a management or generation fee, paying the remainder to the performing firm. The amounts paid to the latter are not included in fees of the collecting firm when determining its ranking. Ties are broken by rank from last year. Where applicable, all percentages are based on responding Giants, not their total number.
All research conducted by ThinkLab, the research division of SANDOW Design Group.
read more
Awards
Interior Design’s 2022 Best of Year Award Winners
See Interior Design’s 2022 Best of Year Award winners, representing the best A&D projects and products from across the globe.
Research
Interior Design Unveils the 2023 Top 100 Giants
Interior Design unveils the Top 100 Giants of 2023. Research suggests the A&D industry is bouncing back after a challenging few years. See the stats.
Research
Interior Design Unveils the 2022 Rising Giants
Interior Design reveals the 2022 Rising Giants. Read the report.

recent stories
Research
ThinkLab’s Visionary Jeffersonian Dinners Forge New Paths for Local Design
ThinkLab explains how design experts can engage in Jeffersonian dinners to listen, learn, debate, and inspire one another through meaningful dialogue.
Research
Interior Design Unveils the 2023 Sustainability Giants
Eco-conscious design is here. See the trends found among the top 100 environmentally focused firms in Interior Design’s 2023 Sustainability Giants.
Research
Interior Design Spotlights 2023 Healthcare Giants
Three years after the start of the pandemic, the 2023 Interior Design Healthcare Giants give a pulse on the state of healthcare design today.