Interior Design Spotlights 2023 Healthcare Giants
What’s most interesting about the Healthcare Giants isn’t the numbers so much as how the business has evolved during the pandemic—and in general. Consider colonoscopies, tonsillectomies, and other minor procedures that were always a little too major to happen outside a hospital setting. The rise of skilled-care facilities and those dedicated to a single function, such as outpatient procedures or diagnostic imaging, have resulted in lots of smaller design projects. In 2019 the Healthcare Giants worked on 3,200; in 2022 that number rose to 5,500—a 73 percent increase partially attributed to smaller COVID-related projects that may not have otherwise happened. But there’s no question that the design of the physical environment is changing.
And yet, hospital design work remains a stalwart: Acute-care hospitals accounted for half of 2022’s $698 million fees—a bit below the COVID-boosted $790 million in 2020, but handily beating the $607 million pre-pandemic dollars. (The most growth, however, is projected for behavioral health and walk-in/urgent-care clinics.) Furniture, fixtures, and construction products also now outstrip 2019 numbers—$17.8 billion versus $14.6 billion.
But there’s a catch: forecasts. The Healthcare Giants predict $562 million fee income and $14.9 billion FF&C income in 2023, both healthy drops. Whether this is something to fear or just the nature of a market over-boiled by a public health emergency and point-of-service changes remains to be seen. This odd combination of instability and prosperity might just stay with us a while longer.
Healthcare Giants Rankings 2023
| wdt_ID | 2023 Rank | Firm | Headquarters | Design Fees (in millions) | FFC Value (in millions) | Sq. Ft. (in millions) | 2022 Rank |
|---|---|---|---|---|---|---|---|
| 1 | 1 | CannonDesign | New York | 70 | 2 | ||
| 2 | 2 | HDR | Omaha, NE | 67 | 214 | 1 | |
| 3 | 3 | Perkins&Will | Chicago | 66 | 1,586 | 3 | |
| 4 | 4 | SmithGroup | Detroit | 57 | 8 | ||
| 5 | 5 | HKS | Dallas | 51 | 7 | ||
| 6 | 6 | AECOM | Dallas | 46 | 2,742 | 6 | |
| 7 | 7 | Perkins Eastman | New York | 42 | 867 | 5 | |
| 8 | 8 | Page Southerland Page | Washington | 41 | 1,891 | 7 | 18 |
| 9 | 9 | Stantec | Edmonton, Canada | 32 | 12 | ||
| 10 | 10 | HOK | St. Louis | 30 | 2,814 | 32 | 9 |
Project Categories
Growth Potential Over Next Two Years
U.S.
| wdt_ID | Region | Percentage |
|---|---|---|
| 1 | Southwest | 57 |
| 2 | Southeast | 55 |
| 3 | Northeast | 53 |
| 4 | Mid-Atlantic | 43 |
| 5 | Midwest | 40 |
| 6 | Midsouth | 40 |
| 7 | Northwest | 28 |
International
| wdt_ID | Region | Percentage |
|---|---|---|
| 1 | Canada | 13 |
| 2 | Europe | 11 |
| 3 | Middle East | 11 |
| 4 | Asia/Australia/New Zealand | 9 |
| 5 | China | 9 |
| 6 | Central/South America | 6 |
| 7 | Mexico | 4 |
| 8 | Caribbean | 2 |
| 9 | India | 2 |
| 10 | Africa | 0 |
| 11 | Other | 2 |
Fees by Project Type
| wdt_ID | Project Type | 2022 Actual | 2023 Forecast |
|---|---|---|---|
| 1 | Acute-care Hospital | 49 | 50 |
| 2 | Outpatient Procedure/Surgery Center | 16 | 13 |
| 3 | Health Clinics | 10 | 9 |
| 4 | Mental-health Facility | 5 | 6 |
| 5 | Rehabilitation Facility | 4 | 3 |
| 6 | Other | 4 | 6 |
| 7 | Senior Living | 3 | 2 |
| 8 | Doctor/Dental Office | 3 | 4 |
| 9 | Health & Wellness/Fitness Center | 3 | 3 |
| 10 | Assisted Living | 2 | 2 |
| 11 | Skilled-nursing Facility/Hospice | 1 | 2 |
| 12 | Telehealth Facility | 0 | 1 |
Editor’s Note: Take a look at recent coverage of our Healthcare Giants most admired firms of 2023 below. CannonDesign tops the list followed by Perkins&Will, and ZGF.
Read More About CannonDesign

Projects
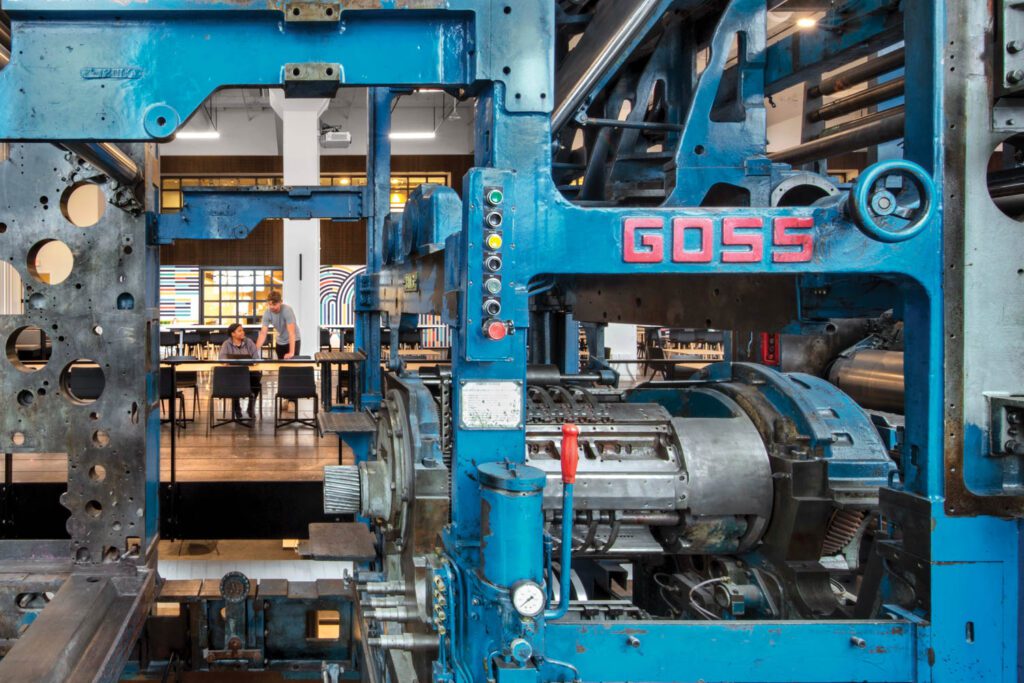
CannonDesign Transforms the Interiors of a Former Newspaper Building into Modern Tech Offices
Vintage printing machinery, housed in a former newspaper building, enlivens new offices for Square and Cash App in St. Louis.
Projects
CannonDesign Swaps Old for High-Tech for the Cboe Global Markets in Chicago
CannonDesign swaps old for high-tech for the Cboe Global Markets headquarters inside a Chicago landmark.
Projects
CannonDesign Creates a Collaborative Office for Upwork in Downtown Chicago
Upwork, a web platform that connects freelancers of all skills to jobs of all kinds, is all about collaboration. And the Chicago team’s new downtown office in the western portion of the Loop is designed with that i…

Read More About Perkins&Will
Projects
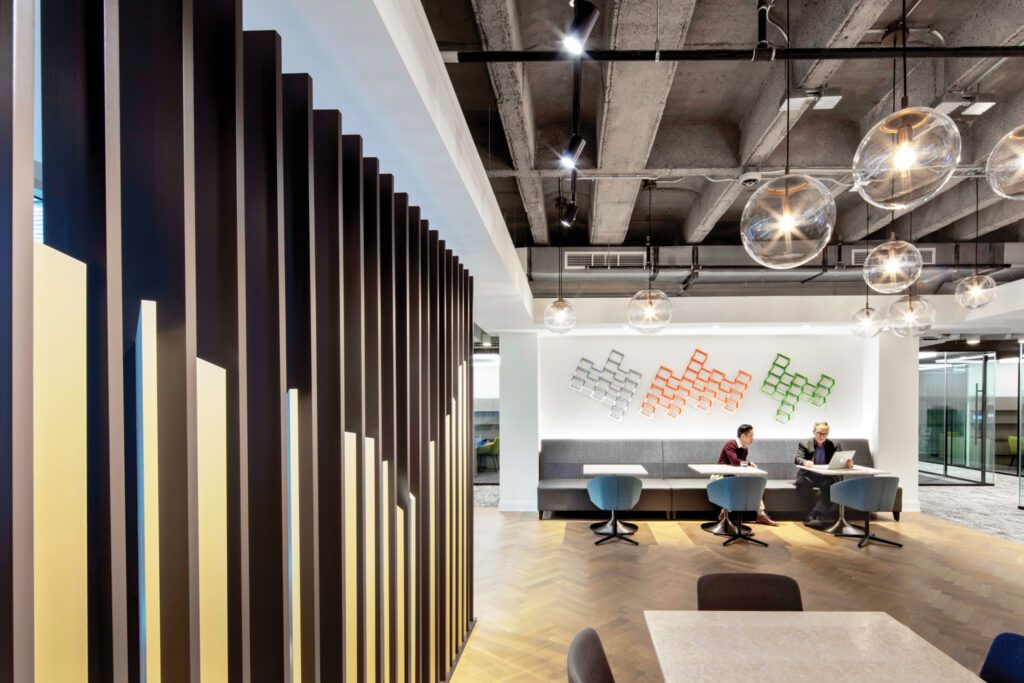
Perkins&Will Puts Environmental Initiatives at the Fore for This Office in Houston
2021 Best of Year winner for Large Corporate Office. Perkins&Will consolidates the headquarters of the Waste Management office in Houston.
Projects
Perkins&Will Takes Home a Best of Year Award for Nemesis Coffee in Vancouver, Canada
2021 Best of Year winner for Hospitality – Coffee Counter. Comprising 10 petals of CNC-cut laminated timber clad in cherry-hued composite-aluminum shingles, this pavilion, an existing structure by Perkins&Will, is round …
Projects
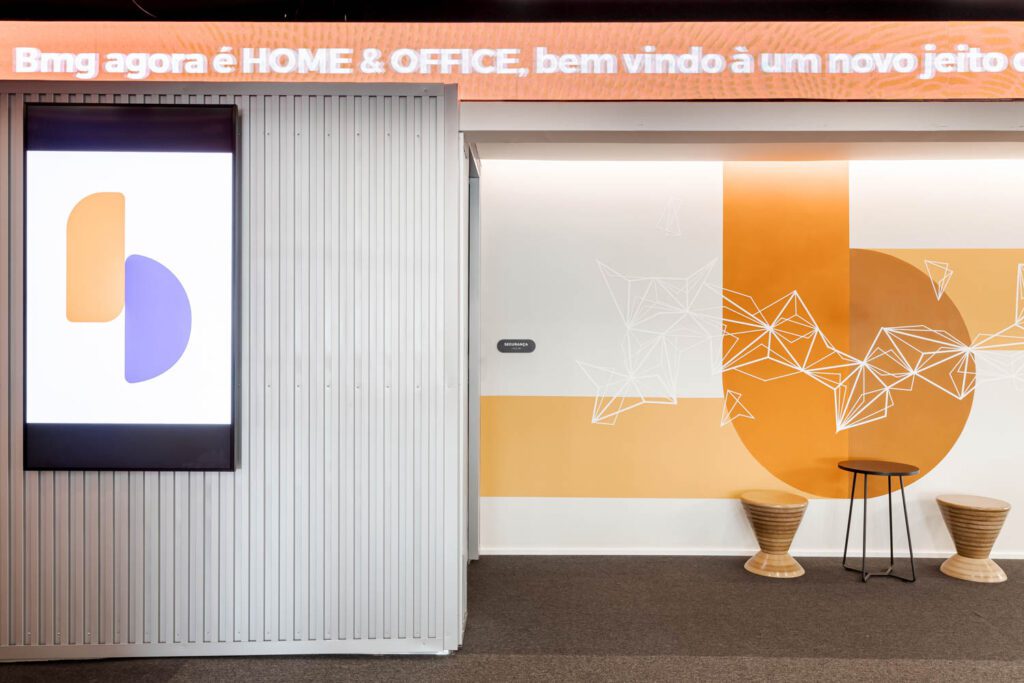
Perkins&Will Brings a Brutalist Gem into the 21st Century for BMG Bank in São Paulo, Brazil
São Paulo has one of the world’s great collections of Brutalist buildings, including a 1984 gem by Marcello Fragelli, now the home to a headquarters for BMG Bank courtesy of transformation by Perkins&Will.


Read More About ZGF
Projects
ZGF Designs a New Center for Mental Health at University of California, San Francisco
ZGF Architects designs a light-filled center for mental health for USCF’s Department of Psychiatry and Behavioral Sciences.
Projects
ZGF Architects Rises to the Living Building Challenge With This Office Complex in Portland
Take a look at this living building in Portland by ZGF that was designed to last 500 years.
Projects
ZGF Architects Adapts a Derelict Campus Building in Los Angeles into an Energy-Efficient Educational Space
It’s a universal axiom: The most sustainable building is the one that is not built. ZGF adopted this principle as the plot line in renovating and repurposing a somewhat Brutalist building on the campus of California St…
Firms with the Most Fee Growth
| wdt_ID | Firm | 2021 | 2022 |
|---|---|---|---|
| 1 | Page Southerland Page | 11,746,560 | 40,961,000 |
| 2 | SmithGroup | 34,237,879 | 56,697,832 |
| 3 | HKS | 40,249,723 | 51,171,914 |
| 4 | CannonDesign | 60,000,000 | 70,000,000 |
| 5 | Perkins&Will | 56,400,000 | 66,300,000 |
| 6 | Jacobs | 3,180,325 | 11,763,190 |
| 7 | Stantec | 23,913,460 | 32,112,724 |
| 8 | HDR | 60,873,600 | 67,111,200 |
| 9 | AECOM | 40,526,200 | 45,705,240 |
| 10 | ZGF | 17,158,000 | 21,238,955 |
Forecasted Change by Segment Over Next Two Years
| wdt_ID | Segment | More Projects | No Change | Fewer Projects |
|---|---|---|---|---|
| 1 | Hospital | 54 | 26 | 4 |
| 2 | Assisted/Senior Living | 54 | 25 | 4 |
| 3 | Rehabilitation Facility | 35 | 35 | 7 |
| 4 | Outpatient Procedure/Surgery Center | 54 | 24 | 2 |
| 5 | Mental-health Facility | 76 | 4 | 0 |
| 6 | Doctor/Dental Office | 26 | 41 | 7 |
| 7 | Health Clinics | 67 | 17 | 0 |
| 8 | Health & Wellness/Fitness Center | 43 | 30 | 4 |
| 9 | Skilled-nursing Facility/Hospice | 20 | 41 | 4 |
| 10 | Private Sector | 28 | 35 | 4 |
| 11 | Public Sector | 22 | 40 | 2 |
| 12 | Other | 50 | 17 | 17 |
Methodology
The Interior Design Giants annual business survey comprises the largest firms ranked by interior design fees for the 12-month period ending December 31, 2022. The listings are generated from only those surveyed. To be recognized as a top 100, Rising, Healthcare, or Hospitality Giant, you must meet the following criteria: Have at least one office location in North America, and generate at least 25% of your interior design fee income in North America. Firms that do not meet the criteria are ranked on our International Giants list. Interior design fees include those attributed to:
1. All aspects of a firm’s interior design practice, from strategic planning and programming to design and project management.
2. Fees paid to a firm for work performed by employees and independent contractors who are “full-time staff equivalent.”
Interior design fees do not include revenues paid to a firm and remitted to subcontractors who are not considered full-time staff equivalent. For example, certain firms attract work that is subcontracted to a local firm. The originating firm may collect all the fees and retain a management or generation fee, paying the remainder to the performing firm. The amounts paid to the latter are not included in fees of the collecting firm when determining its ranking. Ties are broken by rank from last year. Where applicable, all percentages are based on responding Giants, not their total number.
All research conducted by ThinkLab, the research division of SANDOW Design Group.
read more
Research
Interior Design Unveils the 2023 Top 100 Giants
Interior Design unveils the Top 100 Giants of 2023. Research suggests the A&D industry is bouncing back after a challenging few years. See the stats.
Research
Healthcare Giants 2022
See the latest trends in the health and wellness design sector in our 2022 report on Interior Design’s Healthcare Giants.
Awards
Presenting the Metaverse Architecture and Design Awards Winners
Interior Design unveils the winners of the industry’s first Metaverse Architecture and Design Awards (MAD), honoring innovative concepts in virtual realm.


recent stories
Research
ThinkLab’s Visionary Jeffersonian Dinners Forge New Paths for Local Design
ThinkLab explains how design experts can engage in Jeffersonian dinners to listen, learn, debate, and inspire one another through meaningful dialogue.
Research
Interior Design Unveils the 2023 Sustainability Giants
Eco-conscious design is here. See the trends found among the top 100 environmentally focused firms in Interior Design’s 2023 Sustainability Giants.
Research
Introducing Interior Design’s 2023 Hospitality Giants
Interior Design’s 2023 Hospitality Giants demonstrate that the industry is bouncing back. Get the inside scoop on the sector’s comeback story.